
Georg Lukas, 2025-11-11 18:24
For my time-lapse photography, I'm using darktable to develop the pictures, processing hundreds, sometimes over a thousand, RAW photos for a single scene. Often, getting a good result requires multiple iterations of export and video rendering, with each export usually taking half an hour or longer on my slightly dated PC.
With OpenCL, exports can be significantly accelerated if the workload fits into GPU memory (darktable will apply image tiling on some, but not all modules).
This post outlines how to identify workloads that don't run on the GPU, slowing down the export pipeline, how to understand how much more GPU memory you will need, and how to make available that memory or change your workflow to require less of it.
Background
There is an excellent and comprehensive darktable OpenCL benchmark that I'm using as inspiration for the benchmark CLI commands.
Furthermore, the darktabe manual has a section on memory & performance tuning describing the config parameters you can tune to improve GPU memory performance.
Both references outline how to obtain the benchmark values, and this post is meant to show how to parse and interpret them.
Huge thanks go to the people in #darktable on OFTC, who were very helpful by providing the right pointers (and had to bear with me while I was figuring out the details)!
Performing Measurements
The benchmark page suggests to run the darktable-cli command-line interface as
follows:
# CPU only:
darktable-cli setubal.orf setubal.orf.xmp test.jpg --core --disable-opencl -d perf
# CPU + GPU, using OpenCL:
darktable-cli setubal.orf setubal.orf.xmp test.jpg --core -d perf -d opencl
You need to prepare a RAW image (setubal.orf) and its accompanying .xmp
sidecar with the desired edits. The call will initialize the pipeline and
process the RAW image, exporting it into test.jpg. The arguments after
--core are passed to darktable, enabling debugging (-d) for the opencl
and perf (performance) subsystems.
There are some more things we will need that are hidden in the -d memory and
-d pipe (processing pipeline) subsystems.
All these debug flags will make darktable very verbose, so we'll have to
heavily apply grep to filter the noise out.
Interpreting Debug Logs
Logs from perf
The perf subsystem alone will already provide two useful outputs.
First, the time needed by each module during the pipeline and how it is
executed. Grep for dev_pixelpipe:
4.3001 [dev_pixelpipe] took 0.000 secs (0.000 CPU) initing base buffer [export]
4.3474 [dev_pixelpipe] took 0.047 secs (0.016 CPU) [export] processed `rawprepare' on GPU, blended on GPU
4.3651 [dev_pixelpipe] took 0.018 secs (0.016 CPU) [export] processed `temperature' on GPU, blended on GPU
4.4022 [dev_pixelpipe] took 0.037 secs (0.031 CPU) [export] processed `highlights' on GPU, blended on GPU
4.5788 [dev_pixelpipe] took 0.177 secs (0.062 CPU) [export] processed `demosaic' on GPU, blended on GPU
4.6352 [dev_pixelpipe] took 0.056 secs (0.016 CPU) [export] processed `lens' on GPU, blended on GPU
4.7016 [dev_pixelpipe] took 0.066 secs (0.031 CPU) [export] processed `ashift' on GPU, blended on GPU
4.7428 [dev_pixelpipe] took 0.041 secs (0.031 CPU) [export] processed `exposure' on GPU, blended on GPU
4.7930 [dev_pixelpipe] took 0.050 secs (0.031 CPU) [export] processed `crop' on GPU, blended on GPU
4.8451 [dev_pixelpipe] took 0.052 secs (0.016 CPU) [export] processed `colorin' on GPU, blended on GPU
4.9222 [dev_pixelpipe] took 0.077 secs (0.047 CPU) [export] processed `channelmixerrgb' on GPU, blended on GPU
5.9323 [dev_pixelpipe] took 1.010 secs (0.109 CPU) [export] processed `colorbalancergb' on GPU, blended on GPU
6.0176 [dev_pixelpipe] took 0.085 secs (0.000 CPU) [export] processed `agx' on GPU, blended on GPU
7.8012 [dev_pixelpipe] took 1.784 secs (2.469 CPU) [export] processed `bilat' on CPU, blended on CPU
8.0536 [dev_pixelpipe] took 0.252 secs (0.188 CPU) [export] processed `colorzones' on GPU, blended on GPU
8.1302 [dev_pixelpipe] took 0.077 secs (0.062 CPU) [export] processed `finalscale' on GPU, blended on GPU
8.2186 [dev_pixelpipe] took 0.088 secs (0.031 CPU) [export] processed `colorout' on GPU, blended on GPU
Each line prints the (wall-clock) time spent, the CPU time (this is a sum from all CPU cores used, and thus can be higher than the wall-clock time), and whether the module was executed "on CPU" or "on GPU".
If you have very good eyes, you will see that one module, namely bilat (the
internal name for "local contrast") is the only one processed "on CPU":
… took 1.784 secs … [export] processed `bilat' on CPU, blended on CPU
Also bilat is the slowest module, taking 1.784s, with colorbalancergb being
a distant second at 1.010s (I'm using a blend mask to increase the saturation
of the sky in this image, which is probably the costly calculation that I cannot
get rid of).
The internal module names correspond to the file names in darktable's
src/iop directory
and the human-readable name is returned by the respective module's
name() function.
The second useful output from perf comes at the end, and shows the wall-clock
time and the CPU time used for the whole image export pipeline:
8.2709 [dev_process_export] pixel pipeline processing took 3.975 secs (3.203 CPU)
We have to multiply this with the number of photos in our export batch to estimate whether we need to grab a coffee or to take a nap.
This tells us that exporting a picture takes 3.975s, half of which is spent in
bilat on the CPU, but it doesn't say why the GPU isn't used.
Logs from pipe
To find out why bilat is running on the CPU, we need to add -d pipe to the
mix, which will give us the following three lines about bilat:
6.1278 transform colorspace  CPU [export]  bilat  6900  (0/0)  4254x2392 sc=1.000; IOP_CS_RGB -> IOP_CS_LAB `linear Rec2020 RGB'
6.4772 process               CPU [export]  bilat  6900  (0/0)  4254x2392 sc=1.000; IOP_CS_LAB 1520MB
7.7461 blend with form       CPU [export]  bilat  6900  (0/0)  4254x2392 sc=1.000; IOP_CS_LAB, BLEND_CS_LAB
The relevant info is hidden at the end of the second line: 1520MB is the
memory needed to process the image with bilat. This is less than the 2GB of
GPU memory we have, so why does it fail?
Logs from opencl + memory
Certain outputs require a combination of multiple -d flags, like the GPU
memory tracking which only works with -d opencl -d memory:
…
6,1174 [opencl memory] device 'NVIDIA CUDA NVIDIA GeForce GTX 950' id=0: 0.0MB in use, 989.7MB available GPU mem of 2047.8MB
6.1278 transform colorspace  CPU [export]  bilat  6900  (0/0)  4254x2392 sc=1.000; IOP_CS_RGB -> IOP_CS_LAB `linear Rec2020 RGB'
…
[opencl_summary_statistics] device 'NVIDIA CUDA NVIDIA GeForce GTX 950' id=0: peak memory usage 548.5 MB
This will print the video memory use on each allocation and the overall peak memory use at the end.
As can be seen here, there is only 989.7MB of available GPU memory, despite 0MB
being in use. nvidia-smi also confirms there are no other allocations, so
darktable should be able to utilize the full 2GB.
Increasing darktable's GPU memory
When darktable is started with -d opencl, it will also show the GPU
parameters in the beginning, including the total GPU memory of 2GB:
[dt_opencl_device_init]
DEVICE:                0: 'NVIDIA GeForce GTX 950', NEW
…
DEVICE_TYPE:           GPU, dedicated mem
GLOBAL MEM SIZE:       2048 MB
MAX MEM ALLOC:         512 MB
However, as outlined in the memory & performance tuning / darktabe resources section in the manual, darktable will restrict the GPU memory allocation based on two factors, to prevent resource exhaustion:
- headroom: hardcoded 600MB reserve(*)
- darktable resource profile, OpenCL memory: fraction of the remaining GPU
memory, with a default of
700(and a divisor of1024)
The formula is:
usable_memory = (total_memory - headroom) * opencl_memory / 1024
On a 2GB GPU with the "default" memory allocation profile this means:
usable_memory = (2GB - 600MB) * 700 / 1024 = 989.7MB
(*) the docs say that the "headroom" can be disabled by setting the "use all GPU memory" option in the settings, but that option was restricted to multi-GPU systems due to users accidentally enabling it without understanding the side effects. On a single-GPU system, there is no way to disable the headroom.
Performance profiles
In addition to "default" there is also a "small" and a "large" performance profile.
The "large" profile increases the GPU memory fraction from 700 to 900, thus
giving us 1272MB. Manually changing the resource_large value from 900 to the
maximum allowed 1024 in darktablerc brings us to 1448MB, still 72MB short of
the 1520MB needed for bilat. Bummer.
Secret debug profiles
However, there is another path outlined in the dt_opencl_check_tuning() function.
If a negative level is set, the headroom value is ignored.
The level variable corresponds to the resource profile, and negative values
correspond to debug / performance testing profiles that only be defined on the
command line (mapping reference):
-1= "reference" = 8GB RAM, 2GB video RAM-2= "mini" = 1GB RAM, 0.2GB video RAM-3= "notebook" = 4GB RAM, 1GB video RAM
WARNING: kids, don't do this at home!
Running darktable --conf resourcelevel="reference" will ignore the safety
limits of darktable and the physical limits of your hardware and just assume
that your GPU has 2GB of video RAM available.
Let's see how that goes on our 2GB GPU:
3.8193 [opencl memory] device 'NVIDIA CUDA NVIDIA GeForce GTX 950' id=0: 310.5MB in use, 2048.0MB available GPU mem of 2047.8MB
4.1378 [dev_pixelpipe] took 0.319 secs (0.234 CPU) [export] processed `bilat' on GPU, blended on GPU
…
4.4987 [dev_process_export] pixel pipeline processing took 1.415 secs (1.078 CPU)
[opencl_summary_statistics] device 'NVIDIA CUDA NVIDIA GeForce GTX 950' id=0: peak memory usage 1452.8 MB
By manually overriding all the safety margins, we get bilat to run on the GPU,
consuming 75% of video memory, and accelerating the overall pipeline from 3.97s to
1.415s (-63%).
However, driving without seatbelts is not sustainable, and maybe we can get
around the problem by reducing the memory needed by bilat somehow?
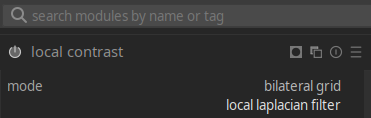
"Local contrast" GPU memory use
The bilat "local contrast" module supports
two modes,
"local laplacian" (default, more robust) and "bilateral grid":
The memory requirements are calculated based on a rather complex formula in the
tiling_callback() function.
The tiling->factor value defines the memory required for processing an image,
relative to its size in bytes. For laplacian mode, it depends on the number of
scaling levels required at a given image resolution, and ends up being ~9.33 for
a 4254x2392 pixels image, which totals to 1520MB at 16 bytes per pixel (4
channels with 4-byte float values):
4254*2392*16*9.33 ≈ 1520MB
Notably, tiling is unsupported in laplacian mode, so the module needs to allocate all of that GPU memory at once.
Given that tiling is only disabled in laplacian mode, we can try the "bilateral grid" mode to see if it is more efficient. The algorithm is different, needs a higher "detail" value to achieve a similar effect, and might end up with artifacts.
However, it allows shifting the workload from the CPU to the GPU without hacks:
3.0816 [dev_pixelpipe] took 0.000 secs (0.000 CPU) initing base buffer [export]
3.1319 [dev_pixelpipe] took 0.050 secs (0.078 CPU) [export] processed `rawprepare' on GPU, blended on GPU
3.1634 [dev_pixelpipe] took 0.031 secs (0.000 CPU) [export] processed `temperature' on GPU, blended on GPU
3.2106 [dev_pixelpipe] took 0.047 secs (0.031 CPU) [export] processed `highlights' on GPU, blended on GPU
3.3463 [dev_pixelpipe] took 0.136 secs (0.156 CPU) [export] processed `demosaic' on GPU, blended on GPU
3.3835 [dev_pixelpipe] took 0.037 secs (0.016 CPU) [export] processed `lens' on GPU, blended on GPU
3.4312 [dev_pixelpipe] took 0.048 secs (0.031 CPU) [export] processed `ashift' on GPU, blended on GPU
3.4737 [dev_pixelpipe] took 0.042 secs (0.031 CPU) [export] processed `exposure' on GPU, blended on GPU
3.5173 [dev_pixelpipe] took 0.044 secs (0.047 CPU) [export] processed `crop' on GPU, blended on GPU
3.5530 [dev_pixelpipe] took 0.036 secs (0.031 CPU) [export] processed `colorin' on GPU, blended on GPU
3.6314 [dev_pixelpipe] took 0.078 secs (0.047 CPU) [export] processed `channelmixerrgb' on GPU, blended on GPU
3.8093 [dev_pixelpipe] took 0.178 secs (0.156 CPU) [export] processed `colorbalancergb' on GPU, blended on GPU
3.8425 [dev_pixelpipe] took 0.033 secs (0.031 CPU) [export] processed `agx' on GPU, blended on GPU
4.0338 [dev_pixelpipe] took 0.191 secs (0.141 CPU) [export] processed `bilat' on GPU, blended on GPU
4.1906 [dev_pixelpipe] took 0.157 secs (0.125 CPU) [export] processed `colorzones' on GPU, blended on GPU
4.2605 [dev_pixelpipe] took 0.070 secs (0.047 CPU) [export] processed `finalscale' on GPU, blended on GPU
4.3451 [dev_pixelpipe] took 0.085 secs (0.062 CPU) [export] processed `colorout' on GPU, blended on GPU
…
4.4328 [dev_process_export] pixel pipeline processing took 1.352 secs (1.094 CPU)
[opencl_summary_statistics] device 'NVIDIA CUDA NVIDIA GeForce GTX 950' id=0: peak memory usage 548.5 MB
The visual result is close to the initial run, but we've reduced the time by 66%, from 3.975s to 1.352s, while significantly reducing the required video memory! This is only marginally faster than ignoring the safety margins in laplacian mode, but much safer to operate.
Conclusion
In most use cases, a few seconds of difference for exporting a JPEG from darktable won't have a measurable effect. However, for exporting a 600-photo time-lapse, we just went from 40 minutes to 14!
Inspecting darktable's detailed performance and memory consumption logs paid off, and allowed us to identify the bottleneck and to work around it!
That said, maybe it's time to replace the decade-old GTX 950 anyway, and a card with 4GB or more will be able to perform the laplacian filter in GPU memory on the "default" profile with no further tuning.